|
Symbols in a Data Table n The size of a data set
(sample size) N The size of a data set
(population size) Mean The mean (sample mean Std. Deviation (S.D.) A standard
deviation (σ) is a measure of how dispersed the data is in relation
to the mean.
Note: The bigger the
SD, the more dispersed the data set. |
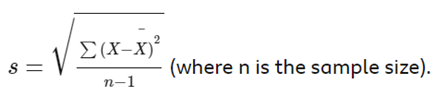
Data Set: 82, 78, 76, 84, 78, 82 ( X ) in Excel file Sample Size n = =count(data set) Sample Mean Sample S.D. s = =stdev(data set) |
|
Hypothesis Testing Q. Which one is easier
and flawless? 1.
To prove H1 is true
2. To reject H0 and accept H1 Research Hypothesis (H1):
All swans are not white. Null Hypothesis (H0):
All swans are white. Note
1: Researchers try to reject H0 and accept H1 rather than trying
to directly prove H1 Note 2: H0
always has a symbol with an equal in it. H1 never has a symbol
with an equal in it. |
|
|
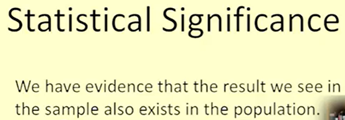
statistically significant, statistical significance
|
|
|
p-value < 0.05 (significance level α) the probability of a
misleading conclusion that
is the probability of
rejecting H0 given that H0 is true or the probability of not
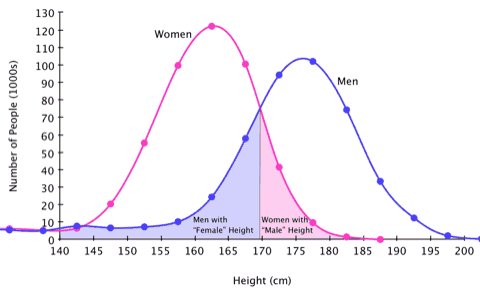
rejecting H0 given that H0 is false Q. Which one is H1?
Which one is H0? 1.
Men are taller than women.
2. Men are not taller than women. Research Hypothesis (H1):
Menheight > Womenheight Null Hypothesis (H0):
Menheight ≦ Womenheight Note: Q. How can statistics
lead to a misleading conclusion? Common ways that
statistics can be misleading include selective bias, neglected sample size,
faulty correlations, and causations, and the use of manipulative graphs and
visuals. |
|
|
Sig. (2-tailed) We want to know whether there is difference between dataset A and dataset B. Sig. (1-tailed) We want to know whether dataset A > dataset B or dataset A < dataset B. |
|
|
df: degree of freedom df = n – 1 |
|
|
Independent Sample t-test
|